
WebAIM published the results of its seventh screen reader survey in December 2017. With nearly 1,800 responses worldwide, it tells us what technologies are in use, and how preferences and usage are changing.
Since I regularly test screen reader usability on mobile devices, I thought I’d discuss the mobile section of the survey. There are a few predictable results, along with a surprise that will change the way I conduct testing.
Lots of screen reader users use mobile devices
Over 1,500 respondents (88%) said they use a screen reader on a mobile device. This continues the upward trend in mobile screen reader use seen over years of WebAIM surveys.
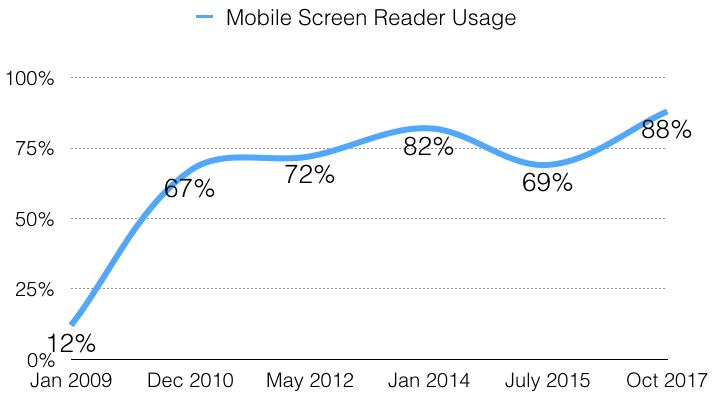
Go to text description of figure 1.
I’m unsurprised by this result. The ubiquitous, affordable nature of mobiles means that most people have a phone or tablet of some sort. For screen reader users, another take-up factor is mobile screen reader performance.
iOS VoiceOver wins the mobile screen reader popularity contest (again)
Apple (76%) continues to lead Android (22%) in the primary mobile screen reader platform stakes. This continues the trend of previous WebAIM surveys.
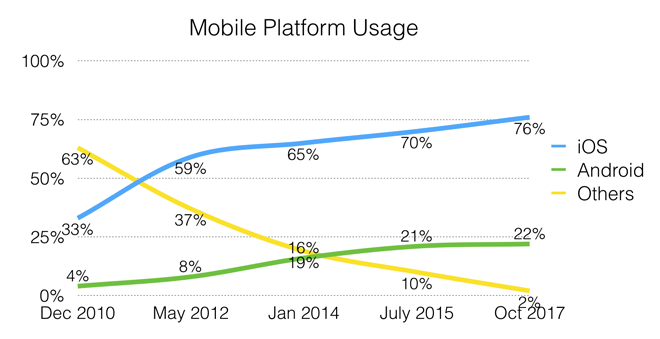
Go to text description of figure 2.
iOS’ screen reader VoiceOver (69%) has the lion’s share of the mobile screen reader market, ahead of TalkBack for Android (29.5%), Voice Assistant (5.2%) and others.
Websites vs. mobile apps
Do you use a website or a mobile app for common online tasks like banking or shopping? If there’s an app that does the job, screen reader users need it to work with their screen reader. My interpretation of the survey result (54% web vs 46% app) is that apps are often not up to scratch.
WebAIM says “[t]hose with advanced screen reader proficiency were much more likely to use the mobile app than those with beginner proficiency”. To me, this implies that advanced users “get by” using workarounds while beginners abandon hard-to-use apps in favour of the web.
On one hand, the web has an international accessibility standard, the W3C’s Web Content Accessibility Guidelines (WCAG). HTML is a mature and robust framework with built-in accessibility features and many tools are available to support developers.
On the other hand, mobile app accessibility… well, anything goes. There isn’t an app accessibility standard, though the BBC’s Mobile Accessibility Guidelines have applied and extended WCAG principles very well. Apple and Google have each published developer guidelines but they aren’t enforceable or consistent across platforms. There are many app frameworks with varied levels of built-in accessibility, and accessibility support tools are limited.
In my unscientific experience, mobile apps have more basic issues like missing labels, poor reading order and contrast, tiny text, and few element types (e.g. headings) for navigation. I know mobile app developers with good intentions that don’t know where to start without a testable standard. I also know developers that weren’t aware they could “do accessibility” on an app.
Accessible mobile apps: just do it.
Mobile device + keyboard is a thing
The last mobile question in WebAIM’s 2017 screen reader user survey was “When using a mobile screen reader how often do you use an external keyboard?”. The combined “yes” response was much higher than I expected. “Always” + “Often” + “Sometimes” was over 40% of respondents. “Seldom” added another 21%.
Wow. This is something I don’t currently test but perhaps I should! However, I’d like to know more about keyboard type. Is it typically a Bluetooth QWERTY keyboard, like I’m using to write this article? Or a Braille display? Or something else?
I’m also interested to know the popular usage patterns. Is the keyboard just to input data, or for navigation as well?
In any case, this survey result tells us we shouldn’t ignore keyboard compatibility on mobile devices.
Further reading: Data and graphics from WebAIM Screen Reader User Survey #7 Results
Long text-alternative of images
Description of figure 1: Line chart showing percentage of survey respondents that use a screen reader on a mobile device. Data points: January 2009, 12%; December 2010, 67%; May 2012, 72%; January 2014, 82%; July 2015, 69%; October 2017, 88%. Return to figure 1.
Description of figure 2: Line chart showing mobile screen reader users’ preferred mobile device type.
IOS usage: December 2010, 33%; May 2012, 59%; January 2014, 65%; July 2015, 70%; October 2017, 76%.
Android usage: December 2010, 4%; May 2012, 8%; January 2014, 16%; July 2015, 21%; October 2017, 22%.
Other device usage: December 2010, 63%; May 2012, 37%; January 2014, 19%; July 2015, 10%; October 2017, 2%. Return to figure 2.